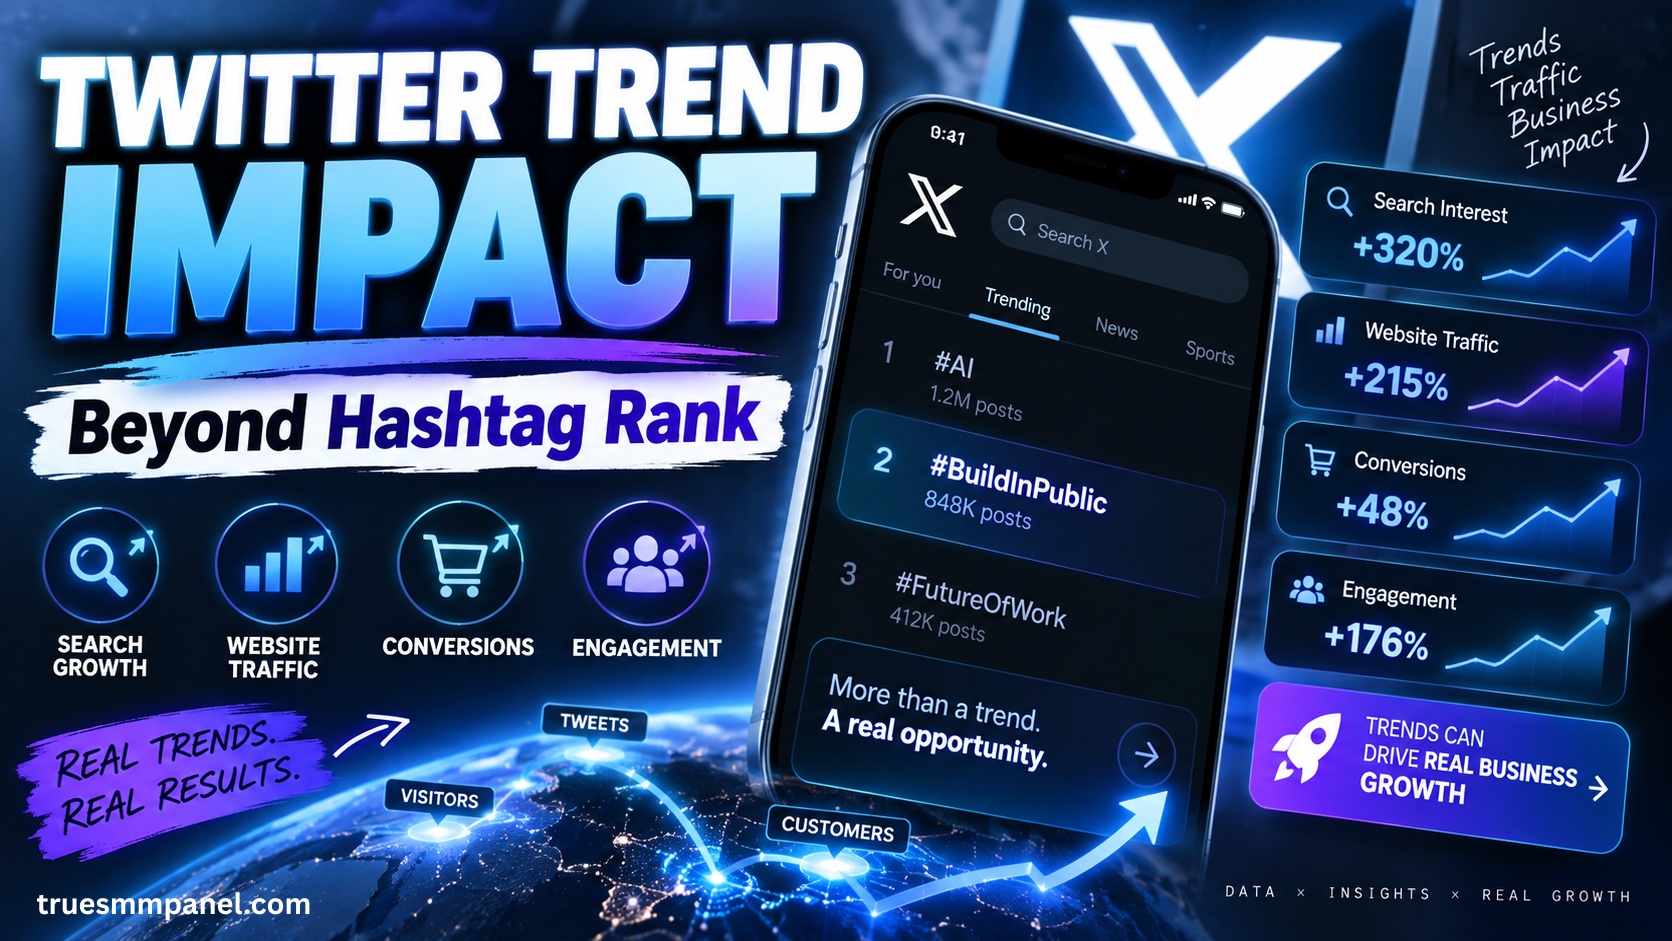
How Do You Measure the Real Impact of a Twitter Trend?
Getting a hashtag into the trending section on X, formerly Twitter, can give your campaign strong visibility. But ranking on the trend board does not tell you whether the campaign actually helped your business.
A better way to measure Twitter trend impact is to track what people do after seeing the campaign.
You should check:
- Google searches for your brand
- Website traffic from X
- User engagement on your website
- Brand mentions on other platforms
- Leads and enquiries
- Sign-ups or purchases
- Assisted conversions
These metrics give you a clearer picture of campaign performance.
1. Check Whether People Search for Your Brand
One useful sign of a successful Twitter campaign is an increase in branded searches.
Someone may see your hashtag on X without clicking anything. Later, they may search for your company directly on Google.
This behaviour shows that the campaign created enough interest for the person to find out more.
What should you track?
Use Google Search Console to monitor:
- Brand name searches
- Product name searches
- Campaign-related keywords
- Service-related searches
- Search impressions
- Search clicks
Compare the numbers before, during and after your campaign.
For example, if your brand normally receives 500 branded search impressions per day and that increases to 1,200 after a trending campaign, the campaign may have increased brand awareness.
How long should you monitor?
Check performance for at least:
24 hours before the campaign
24 to 72 hours after the campaign
For larger campaigns, you can compare data over 7 to 14 days.
2. Measure Website Traffic Coming From X
A trending hashtag can generate thousands of views, but you should also check whether people visit your website.
Google Analytics 4 can help you understand how much traffic came from social media.
Track:
- Users
- Sessions
- Landing page visits
- Engagement rate
- Average engagement time
- Pages viewed
- Conversions
Traffic alone is not enough.
For example, suppose 5,000 people visit your website from a campaign, but most leave within a few seconds. That may mean the campaign reached many people, but the landing page did not match their expectations.
If visitors stay longer, view services and complete forms, the traffic is more valuable.
3. Use UTM Links for Better Tracking
UTM parameters help you identify visitors who came from a specific campaign.
Instead of sharing a normal link such as:
yourwebsite.com/services
you can use a campaign tracking link such as:
yourwebsite.com/services?utm_source=twitter&utm_medium=social&utm_campaign=brand_trend
This makes it easier to separate normal social traffic from campaign traffic.
You can create different UTM links for:
- Main campaign posts
- Influencer posts
- Promotional posts
- Different hashtags
- Different landing pages
This gives you cleaner campaign data.
4. Track What Visitors Do on Your Website
The quality of traffic matters more than the number of clicks.
You should check whether people actually interact with your website after arriving from X.
Useful engagement metrics include:
Engagement time
This shows how long visitors actively spend on your website.
Longer engagement can indicate that users are interested in your content or services.
Scroll depth
Check whether users scroll through your landing page.
If people leave before reaching important sections such as pricing, benefits or contact information, your page may need improvement.
Page views
Users who visit several pages may have stronger interest than someone who leaves immediately.
Button clicks
Track actions such as:
- Contact us
- Get started
- Sign up
- View services
- Request pricing
- WhatsApp enquiry
These actions can help you measure campaign quality.
5. Monitor Brand Mentions Outside Twitter
A successful Twitter trend can continue spreading after the hashtag stops trending.
People may start discussing the campaign on:
- YouTube
- Blogs
- News websites
- Online communities
You should monitor your brand name, campaign name and hashtag across these platforms.
This helps you understand whether the campaign created attention outside X.
For example, if several blogs or social accounts begin mentioning your campaign without being directly paid to do so, you may be receiving additional earned exposure.
6. Measure Brand Sentiment
High engagement does not always mean positive engagement.
You should understand what people are saying about your campaign.
Brand sentiment can usually be grouped into:
- Positive
- Neutral
- Negative
For example, a hashtag could receive 50,000 mentions, but if a large percentage of those mentions are complaints, the campaign result is very different from 50,000 positive mentions.
Monitor comments, replies, quote posts and external discussions.
This gives you better context around your campaign numbers.
7. Track Leads and Conversions
The strongest campaign metric is often the action that directly supports your business.
Depending on your goal, this could include:
- Contact form submissions
- WhatsApp enquiries
- New registrations
- Newsletter subscriptions
- Product purchases
- Service orders
- Demo requests
- App downloads
- Trial registrations
You should decide the campaign goal before launching the trend.
For example:
If your campaign goal is lead generation, track enquiries.
If your goal is e-commerce sales, track purchases.
If your goal is awareness, track branded search, website visits and mentions.
This keeps your reporting focused.
8. Do Not Ignore Assisted Conversions
Some users will not purchase immediately after seeing your Twitter campaign.
A typical journey could look like this:
User sees campaign on X → Visits website → Leaves → Searches brand on Google two days later → Returns → Makes a purchase
If you only look at the final Google visit, you may miss Twitter's role in introducing the customer to your brand.
This is known as an assisted conversion.
GA4 and other analytics platforms can help you study the different channels involved before a conversion.
This is especially useful for campaigns where customers need time before making a decision.
9. Compare Campaign Cost With Business Results
After collecting your data, compare the campaign cost with the results it generated.
For example:
MetricResultCampaign Cost₹50,000Twitter Impressions1,500,000Website Visits12,000Leads Generated350Sales Generated45Revenue₹2,25,000
You can then calculate useful numbers such as:
Cost per website visitor
₹50,000 ÷ 12,000 = approximately ₹4.17
Cost per lead
₹50,000 ÷ 350 = approximately ₹143
Cost per sale
₹50,000 ÷ 45 = approximately ₹1,111
These numbers help you compare Twitter campaigns with other marketing channels.
10. Measure Performance at Different Stages
Twitter trend performance can be divided into different stages.
Campaign StageMetric to TrackWhat It ShowsFirst few hoursHashtag rank, mentions, impressionsInitial reachFirst 24 hoursWebsite traffic, clicks, engagementAudience response24 to 72 hoursBrand searches, external mentionsContinued interestFollowing daysLeads, conversions, salesBusiness resultsLonger termRepeat visits, branded trafficOngoing brand awareness
A hashtag ranking tells you what happened at one moment.
Campaign analytics tells you what happened after people noticed your brand.
How Can Brands Improve Twitter Campaign Tracking?
Good tracking should be prepared before the campaign starts.
Before launching a Twitter trend campaign:
- Set one main campaign goal.
- Record your current website traffic.
- Record your normal branded search volume.
- Create UTM tracking links.
- Set up GA4 conversion events.
- Track enquiry forms and WhatsApp clicks.
- Monitor campaign keywords and brand mentions.
- Compare results after 24 hours, 72 hours and 7 days.
This gives you a clear baseline for measuring performance.
Using Twitter Trending Services With Proper Tracking
Businesses that use Twitter trending services in India should focus on measurement as much as campaign visibility.
Getting a hashtag into the trending section can generate attention, but businesses should still track whether that attention produces real visits, searches, enquiries and conversions.
A reliable SMM panel in India can support social media campaign execution, but your analytics setup should independently measure what happens after users see your campaign.
Campaign success should be based on measurable outcomes rather than hashtag position alone.
Frequently Asked Questions
What is Twitter trend impact?
Twitter trend impact refers to the effect a trending hashtag or campaign has on brand awareness, website traffic, searches, engagement, leads and conversions.
Is hashtag ranking enough to measure campaign success?
Twitter trend impact refers to the effect a trending hashtag or campaign has on brand awareness, website traffic, searches, engagement, leads and conversions.
How can I track Twitter campaign traffic?
Use UTM parameters on campaign links and monitor the traffic inside Google Analytics 4.
How soon should I check campaign results?
Check initial results during the first 24 hours. Continue monitoring search traffic, website visits and conversions for at least 72 hours. Larger campaigns may require 7 to 14 days of monitoring.
Which Google tools can help track Twitter campaigns?
Google Analytics 4 can track website behaviour and conversions. Google Search Console can help you monitor changes in branded search impressions and clicks.
What is an assisted conversion?
An assisted conversion happens when Twitter introduces someone to your brand, but they convert later through another channel such as Google search, direct traffic or email.
What are the most important Twitter campaign analytics?
The most useful metrics usually include:
- Impressions
- Engagement
- Website visits
- Branded searches
- Referral traffic
- Leads
- Sales
- Cost per lead
- Conversion rate
- Assisted conversions